
【论文摘要】In order to formulate policies to control regional air pollution and promote sustainable human–land system development, it is crucial to study the space–time distribution of air pollution and the population exposure risk. Existing studies are limited to individual fine particulate pollutants, which does not fully reflect the comprehensiveness of air quality. In addition, the spatiotemporal distribution of air quality and population exposure risk at different scales need to be further quantified. In this study, we used air monitoring station data and population spatial distribution data to analyze the spatiotemporal characteristics of air quality, including seasonal variations, variations before and during heating periods, and the occurrence frequency of priority pollutants in the raditional industrial areas of Northeast China in 2015. The population exposure–air pollution risk (PE-APR) model was used to calculate the population exposure risk at different spatial scales. The results suggest that GIS methods and air monitoring data help to establish a comprehensive air quality analysis framework, revealing spring–summer differentiation and the change trend of air quality with latitude. There are significant clustering features of air quality. A grid-scale population exposure–air pollution risk map is not restricted by administrative boundaries, which helps to discover high-risk areas of the main regional economic corridors and differences between inner cities and suburbs. This study provides a reference for understanding the space–time evolution of regional air pollution and formulating coordinated cross-regional air pollution strategies.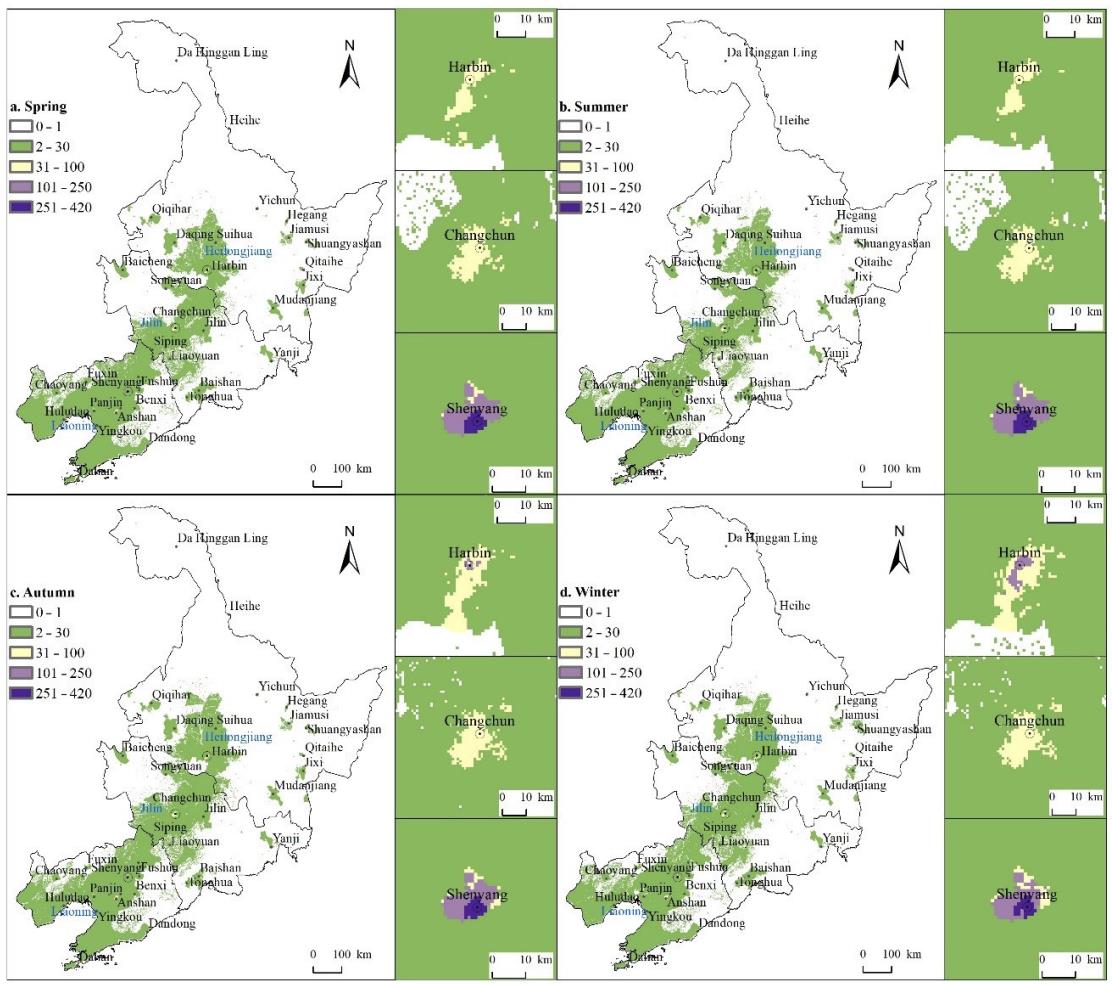
【论文信息】Xiao, X.; Xie, X.; Zhao, B.; Li, J.; Xue, B. Towards Multi-Scale Space-Time Characteristics of Air Quality and Population Exposure Risk. Sustainability 2022, 14, 96. https://doi.org/10.3390/su14010096
Figure . Distribution of PE-APR in each season at grid scale